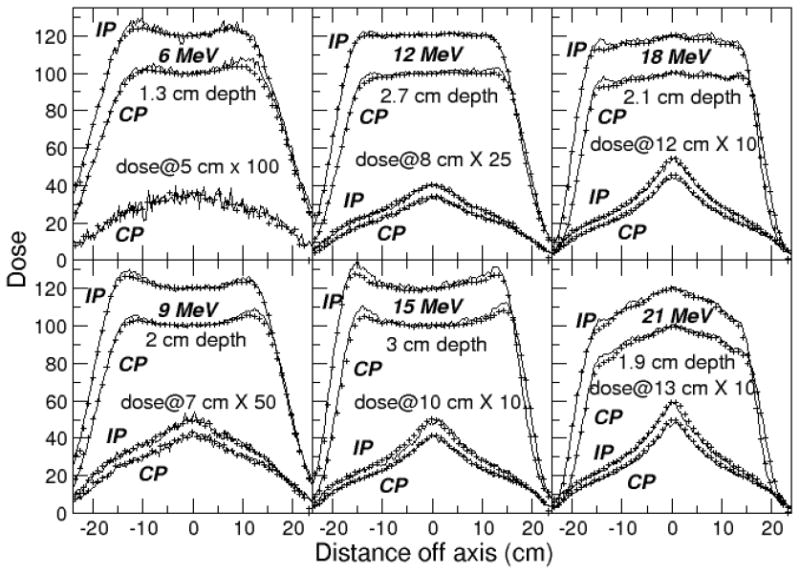
Figure 4.

Profiles calculated with EGSnrc (lines) compared to measurements (points), rebinned to match 0.3 cm wide calculation bins, and showing only every third point. Crossplane (CP) dose distributions normalized to 100% on the central axis at dmax, inplane (IP) to 120%. The ratio of dose on the central axis at the 2 profile depths was preserved.
