
Fig. 1.
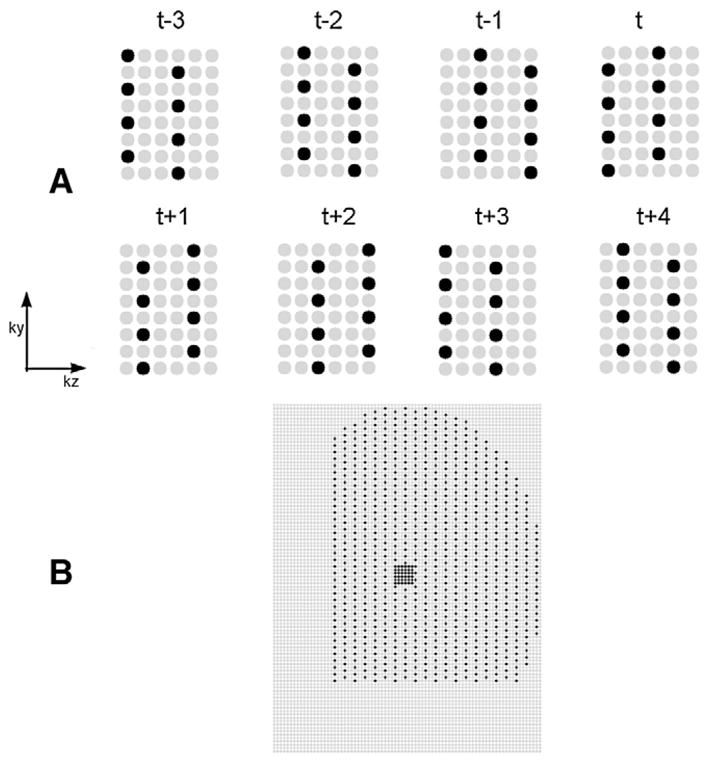
Undersampling pattern for breast DCE data. The gray circles were not sampled, and the black circles were sampled. (A) The outer k-space sampling of eight adjacent time frames. (B) A typical k-space sampling pattern of one time frame.
Official websites use .gov
A
.gov website belongs to an official
government organization in the United States.
Secure .gov websites use HTTPS
A lock (
) or https:// means you've safely
connected to the .gov website. Share sensitive
information only on official, secure websites.
Undersampling pattern for breast DCE data. The gray circles were not sampled, and the black circles were sampled. (A) The outer k-space sampling of eight adjacent time frames. (B) A typical k-space sampling pattern of one time frame.