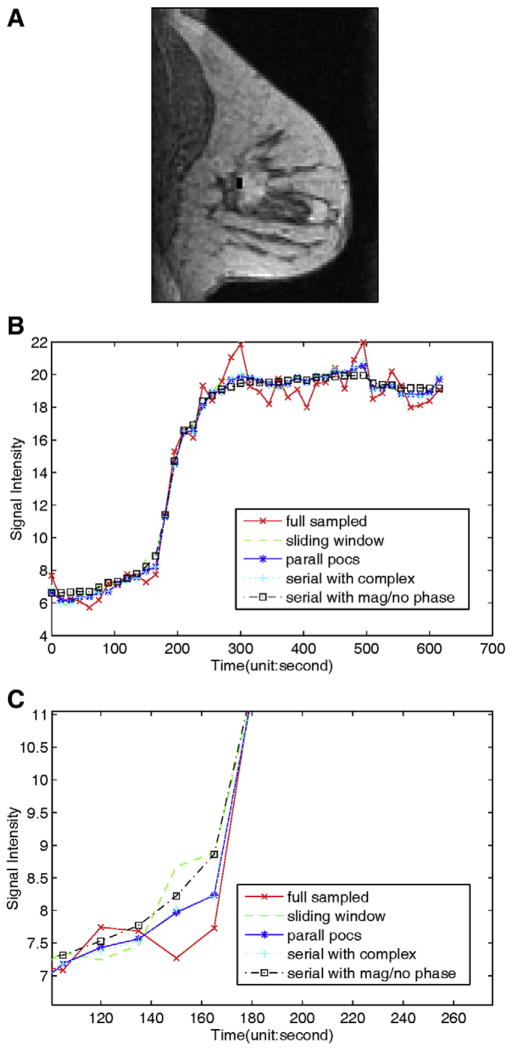
Fig. 5.
Comparison of dynamics of reconstructions from undersampled data (R=6) in two different breast lesion regions using different methods. (A) Images showing the one ROI in the breast lesion, indicated by the small black rectangle. (B) Comparison of mean signal intensity time curves for the lesion region shown in (A), and (C) is the magnified images of (B). The magnified image shows the signal intensity curve of SW methods have a larger deviation from that of the true images.

