
Fig. 7.
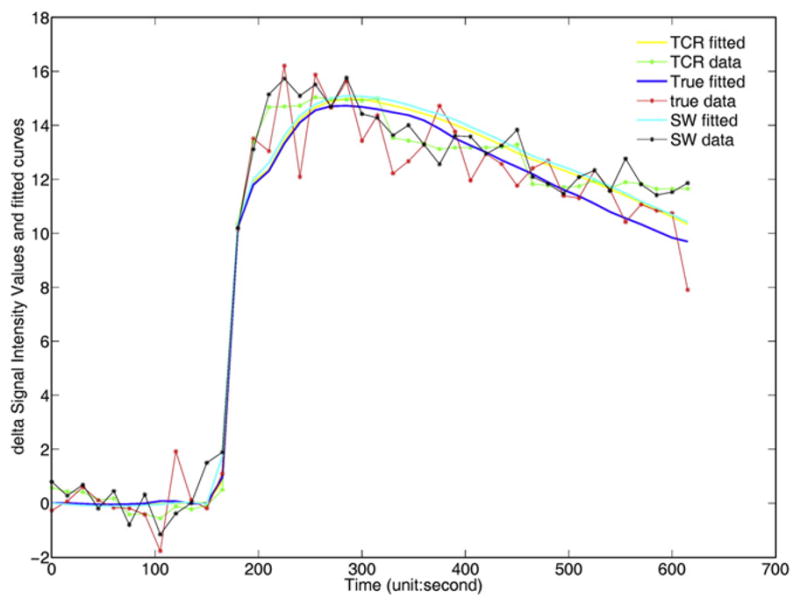
The delta signal intensity values and model fits for images reconstructed from parallel+complex, sliding window and full-sampled data (denoted as “TCR,” “SW,” “True,” respectively). The delta signal intensity value is the intensity value with the mean value of the first ten time frames subtracted off. The plot demonstrates that in particular for the sliding window curve, the fit is much closer to the fully sampled data when the tissue curves increases sharply. This is because the sharp onset of the AIF used does not permit an exact fit to the curve.