
Figure 1.
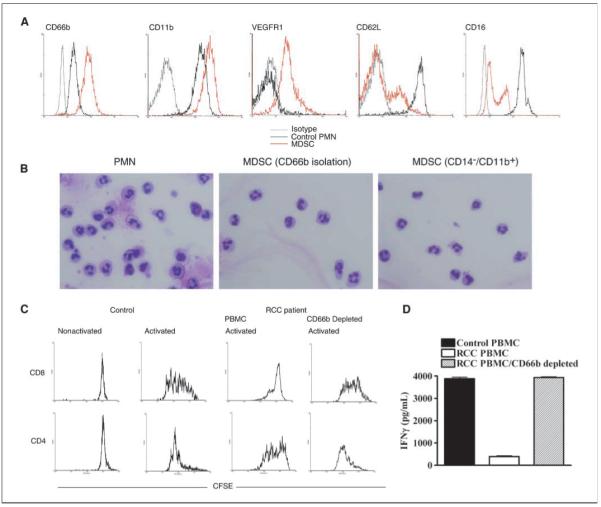
MDSC express markers of activated PMN and suppress CD8+ T-cell proliferation and IFNγ production. A, a representative flowcytometry analysis of MDSC from RCC patients (n = 10) compared with PMN from normal controls (n = 8) showing increased expression of CD66b, CD11b, and VEGFR1 and low expression of CD16 and CD62L in MDSC. B, a representative cytospin of PMN and MDSC (sorted using anti-CD66b or anti-CD11b+/CD14−) from peripheral blood of RCC patients (n = 10). C, 5 × 10⁵ PBMC labeled with CFSE were activated with immobilized anti-CD3 (1 μg/mL) and anti-CD28 (0.1 μg/mL) antibodies. After 96 h of culture, T cells were labeled using antibodies against CD4 and CD8 and proliferation was determined by flow cytometry. D, supernatants were also collected 72 h after stimulation with anti-CD3/CD28 and measured for IFNγ production by ELISA. C and D, experiments were repeated thrice using samples from individual RCC patients and controls.