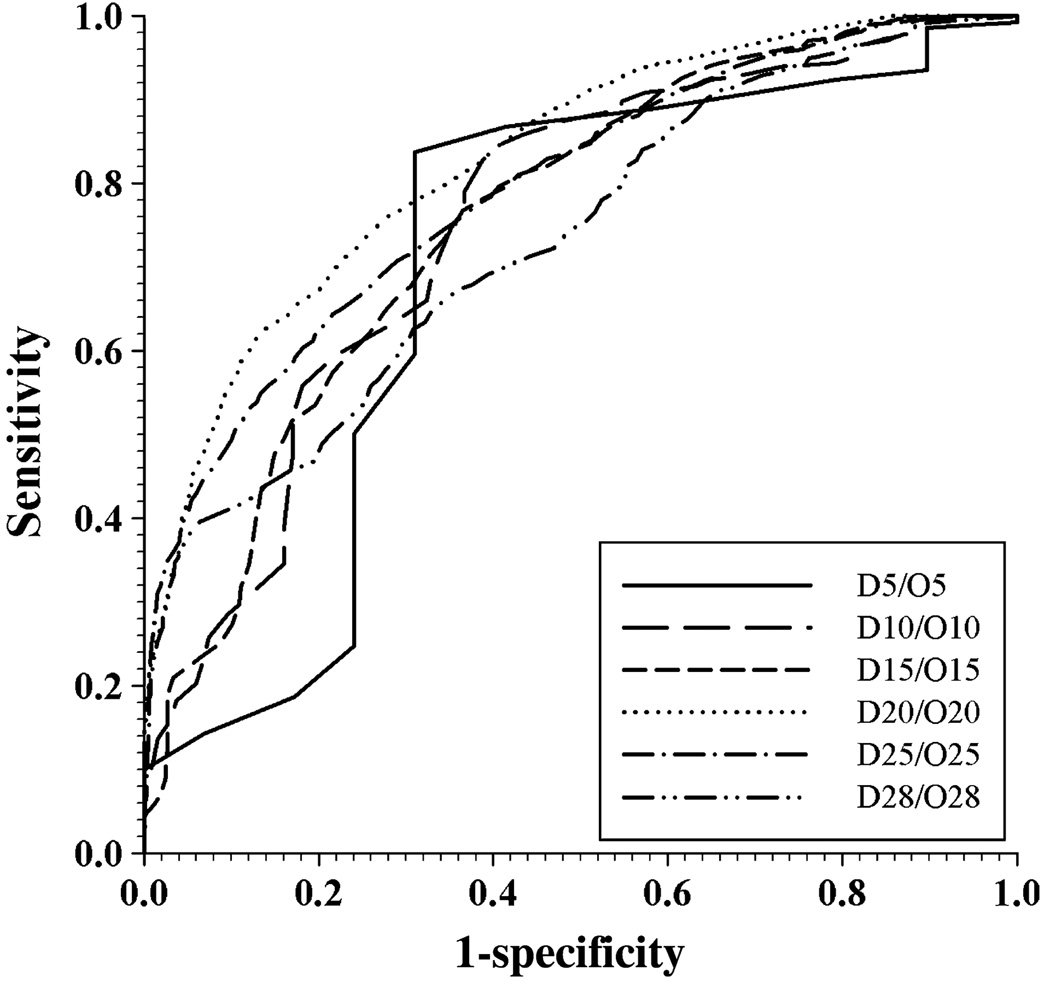
Figure 3.
Receiver operating characteristic (ROC) curve of SPA in DSP/OSP datasets. These two datasets are furthermore grouped into subsets according to the length of segments in them. ‘D’ indicates subsets from DSP while ‘O’ is for subsets from OSP. D5 includes all the segments with segment length less than 5; D10 is for segments longer than or equal to five but <10; D15 corresponds to segments with 10 ≤ L < 15; D20 is 15 ≤ L < 20; D25 is 20 ≤ L < 25; D28 is 25 ≤ L ≤ 28. The same nomenclature is applied to subsets obtained from OSP. Each pair of subsets with the same range of length, originated from DSP and OSP, respectively, are put together to calculate the ROC curve for segments of that length.

