3.
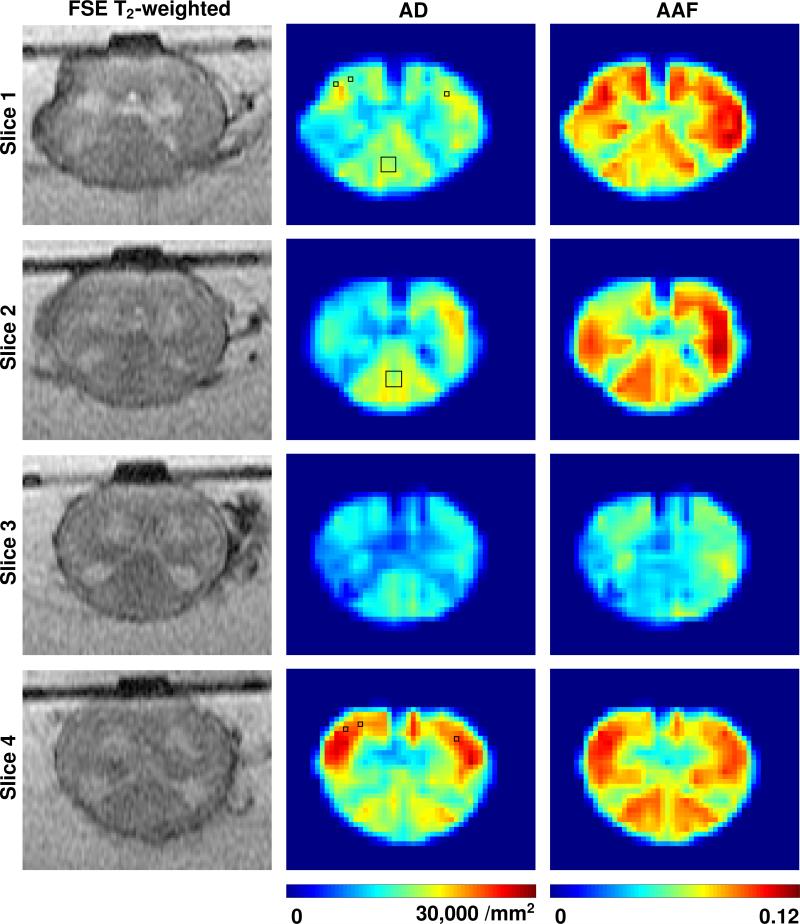
Fast spin echo (FSE) T2-weighted images (105 ms TE), axon density (AD), and axon area-fraction (AAF) maps for four slices of the spinal cord specimen. Bottom of images corresponds to dorsal. Posterior funiculus regions selected in Slices 1 and 2 and anterior funiculus regions selected in Slices 1 and 4, for comparison with manual axon count, are indicated with rectangles on the AD maps. AD and AAF maps are interpolated for better visualization and scaled to have equal intensity range as identified by the color bar at the bottom of each column of maps.

