7.
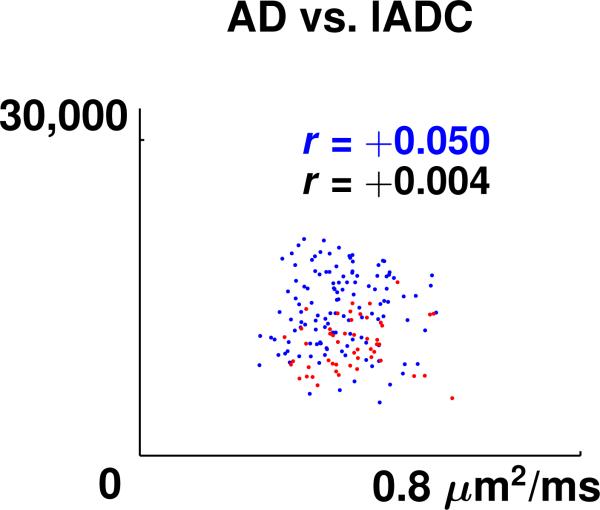
Scatter plot of axon density (AD) vs. longitudinal apparent diffusion coefficient (lADC) for the Slice 2 of the spinal cord specimen. The separation of gray matter pixels (red dots) and white matter pixels (blue dots) was achieved by manual segmentation. Pearson correlation coefficient in the plot is denoted by r. A blue r refers to the correlation coefficient of white matter only and a black r refers to the correlation coefficient of the combined white and gray matter regions.

