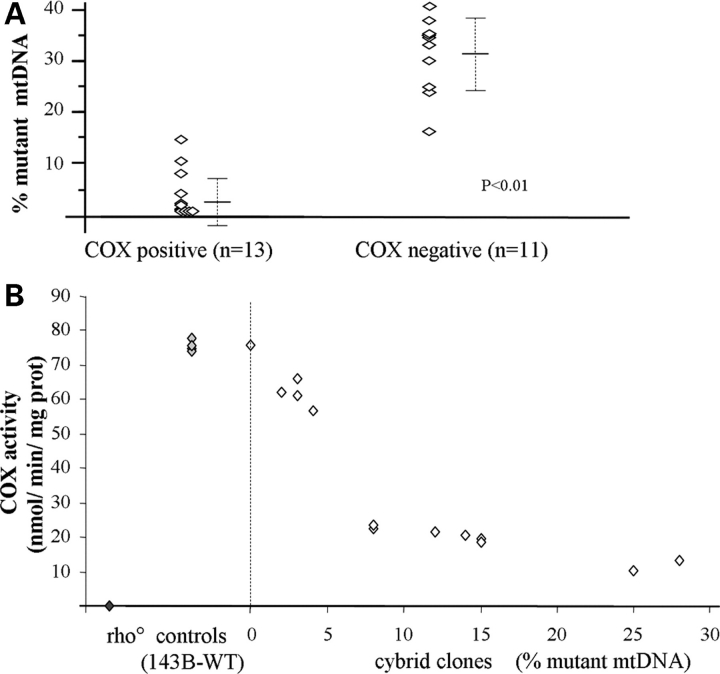
Figure 3.
(A) Distribution of the C5545T mutation in COX-positive and COX-negative muscle fibers. Quantification of mutant mtDNA was performed by single fiber muscle PCR–RFLP analysis. (B) Correlation between mutational load and COX activity in cybrid cell lines, compared with parental 143B and rho° cells. Measurments were performed in triplicates.

