Figure 3.
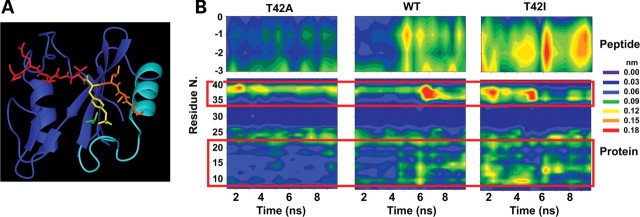
MD simulations. (A) Structure of the N-SH2 domain complexed with the PDGFRB SVLpYTAVQP phosphopeptide (pdb entry 1AYA). The peptide is shown in red with the N-terminal residues (−3 to −1) and the phosphorylated tyrosine (pY) highlighted in orange and yellow, respectively. The N-SH2 domain is displayed in blue with the BC loop, N-terminal helix and adjacent loop highlighted in cyan. The side chain of T42 is shown in green. (B) Mobility of Cα atoms in selected protein and phosphopeptide regions during the simulations of wild-type SHP2, SHP2A42 and SHP2I42. Plots report the atom's root mean square fluctuations as a function of time and residue number. Phosphopeptide Cα atoms are numbered with respect to the pY residue (indicated as 0). Red boxes highlight protein regions where significant mobility differences are observed, corresponding to the BC loop (residues 34–40), the N-terminal helix (residues 13–22) and the loop preceding it (residues 9–12).

