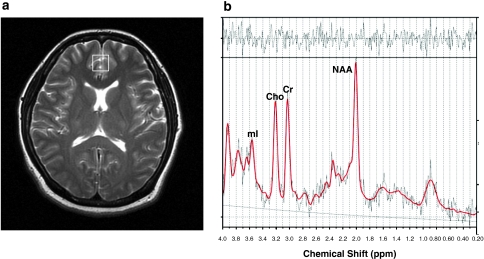
Figure 1.
Voxel placement (a) and representative spectra of a methamphetamine-dependent patient (b). (a) Typical location of voxel (white box) located on the midfrontal gray matter shown in axial T2-weighted magnetic resonance image. (b) Representative proton magnetic resonance spectra of one methamphetamine-dependent patients. LCModel estimated baselines are in smooth gray line. LCModel fit to metabolite signals are in red heavy line. The raw data is in thin gray trace. At the top of each plot, the residual signal after fitting is displayed. NAA, N-acetyl-aspartate/N-acetyl-aspartyl glutamate; Cr, creatine/phosphocreatine; Cho, phosphocholine/glycerophosphocholine; mI, myo-inositol.

