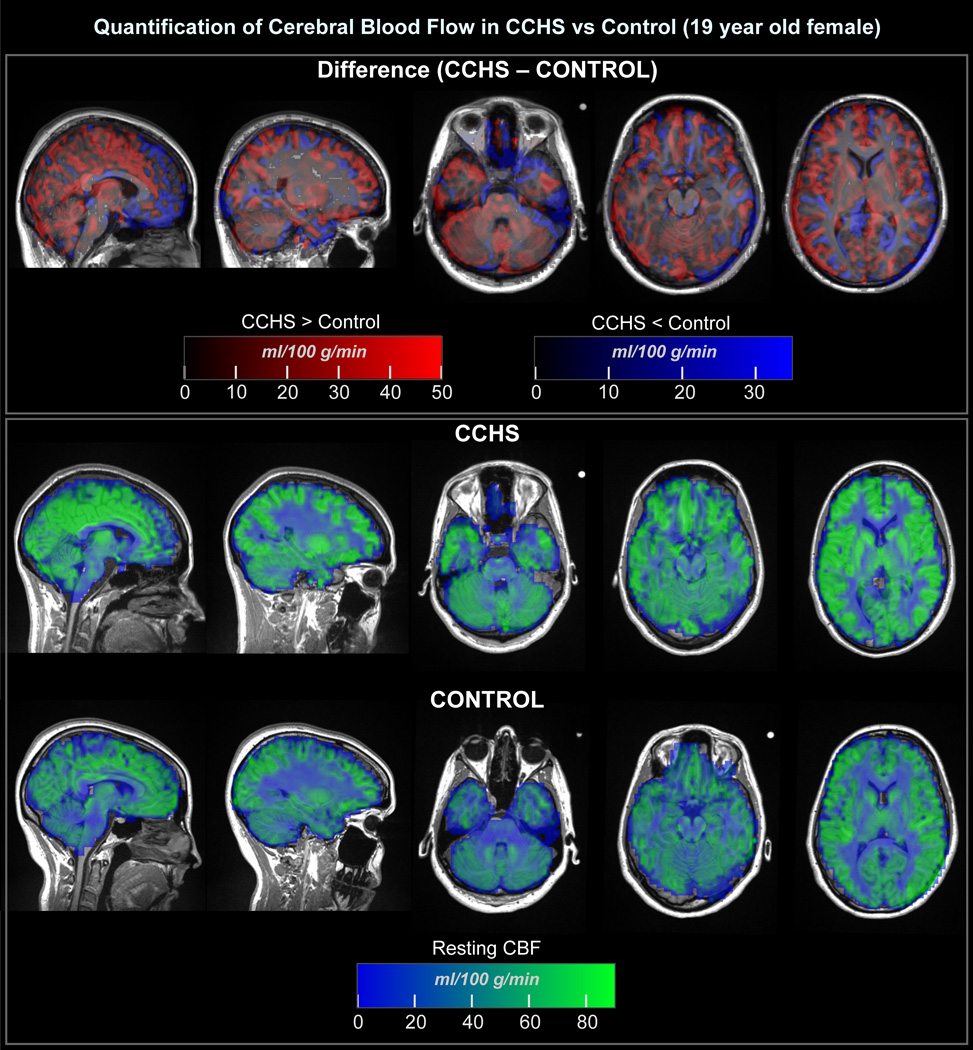
Figure 1.
Absolute cerebral blood flow in a CCHS patient and age-and gender-matched control subject, as measured using 200 resting-state arterial spin labeling CBF measurements in each subject. Flow quantification is displayed in ml/100g/min according to the color scales, overlaid onto the anatomical background. The CCHS and control patients are in their native space, and the difference images are in normalized space, with the background being the average of the two subjects’ normalized anatomical images.

