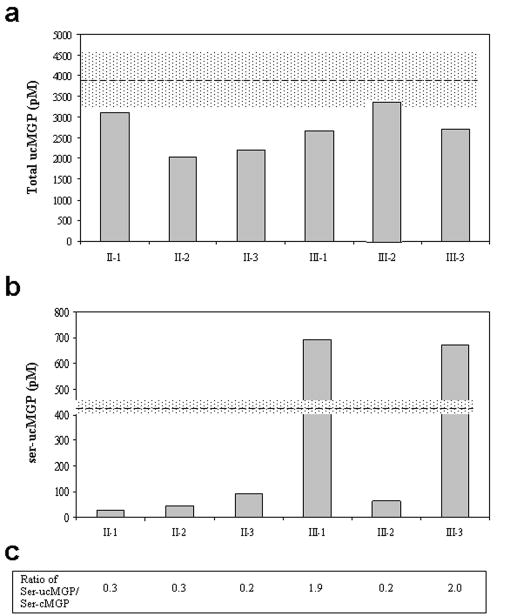
Figure 5. Quantitation of different forms of MGP in plasma by ELISA.
(a) Total, both phosphorylated and non-phosphorylated forms of under-carboxylated MGP (total ucMGP). (b) Assay of non-phosphorylated, under-carboxylated forms of MGP (ser-ucMGP). (c) The ratio of ser-ucMGP/ser-cMGP. The dashed lines in (a) and (b) represent the mean of control specimens and the coefficient of variation (CV) is indicated by the stippled areas (CV=15.7% in a, n=5; CV=6.0% in b, n=100).

