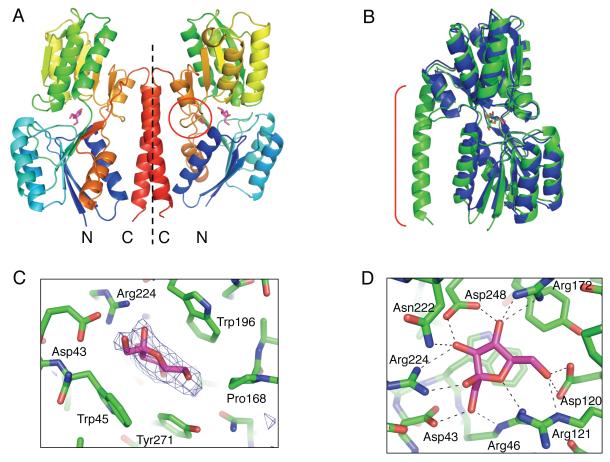
Figure 3. Structure of BT1754-PD in complex with fructose.
A. Representation of the homodimer of BT1754-PD present in the asymmetric unit, with each monomer separated by a dotted line; molecule of fructose (pink); the flexible hinge between the two subdomains (circle).
B. Overlay of BT1754-PD (green) with TtRBP (blue); the extended C-terminal helix in BT1754-PD (bracket) is unique to BT1754.
C. Side view of the binding site illustrating hydrophobic interactions of BT1754-PD and fructose. Fo-Fc electron density prior to modeling the single molecule of fructose in the β-furanose form is shown (blue mesh contoured at 3σ).
D. Top view of the binding site of BT1754-PD illustrating the numerous H-bonds (dotted black lines) with fructose.

