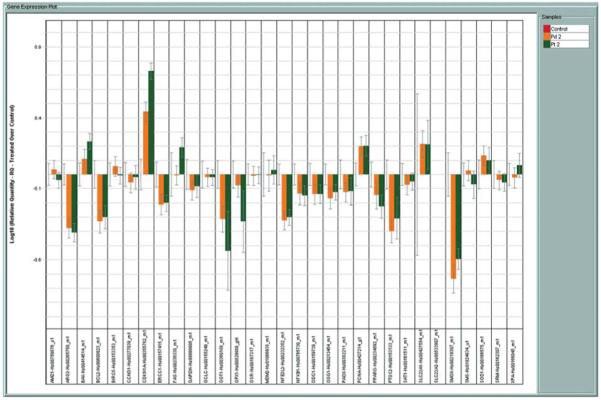
Figure 2.

Expression of genes represented on TLDA in A2780 human ovarian carcinoma cells treated with Pt-spermine and Pd-spermine complexes. Bars are log10 RQ. RQ is the quantity of expression of a given gene relative to the drug untreated control. Bars going upward represent up-regulation and those going downwards down-regulation. Error bars are the confidence intervals compared to the no-drug controls in the first position of each cluster.
