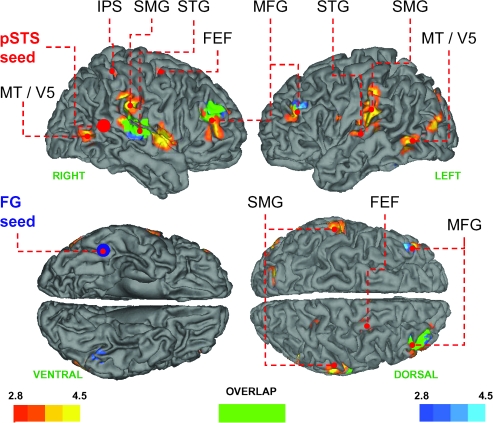
Figure 2.
Brain regions showing positive change in coupling with the right pSTS (red to yellow) and FG (blue to turquoise) while viewing gaze shifts versus opening/closing the eyes. Areas that showed a change in coupling with both FG and pSTS are shown in green. Mean coordinates of the pSTS and FG source regions used in the connectivity analyses are shown as red and blue spheres, respectively. Maps are thresholded at P < 0.005, unc. for visual inspection, and the color bars denote the T statistic range. FEF, frontal eye field; FG, fusiform gyrus; IPS, intraparietal sulcus; MFG, middle frontal gyrus; SMG, supramarginal gyrus; STG, superior temporal gyrus; pSTS, superior temporal sulcus.

