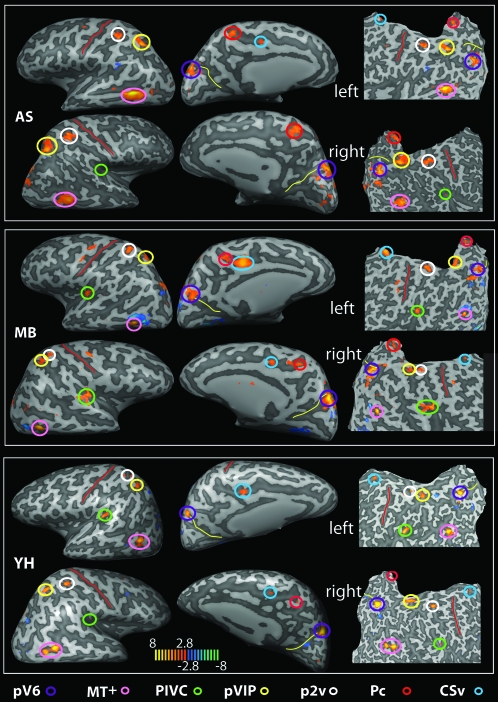
Figure 1.
Brain areas selectively responsive to the egomotion-compatible (EC) stimulus. For 3 participants (AS, MB, and YH), the map of regions showing a significantly greater response to one flow stimulus than to an array of flow stimuli is overlaid onto inflated (left and central panels in each case) and flattened (right panels) representations of the left and right hemispheres. T values are color coded (see color bar). Various active regions are highlighted by colored circles (see color key; all activations shown thresholded at P < 0.005 uncorrected). The red line marks the central sulcus and the yellow line the POS. Pc, precuneus.

