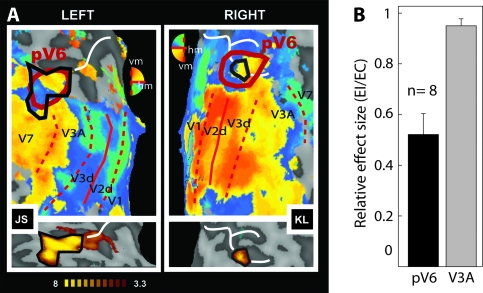
Figure 3.
Sensitivity of putative human V6 to EC visual stimulation. (A) Retinotopic maps (upper panels) and regions selectively responsive to EC (lower panels) overlaid onto flattened representations of the occipital lobes of 2 participants (JS and KL). Retinotopic maps were obtained with wide-field (70°) stimulation and show dorsal visual areas and the demarcation of human pV6 based on retinotopic criteria (thick red line). pV6 has a full hemifield representation with the upper quadrant represented nearer to V2 and the lower quadrant nearer to V3A (note that the color key is vertically reversed for the 2 hemispheres, in BrainVoyager convention). pV6 as defined by sensitivity to EC stimuli, from the lower panel, is also shown (solid black line) on each retinotopic map. Thin red lines show the borders between visual areas (dashed: vertical meridian [vm]; continuous: horizontal meridian [hm]). Representations of different parts of the visual field are color coded (see color wheel [note that colors have opposite dorsal–ventral meanings in the 2 hemispheres]; all activations thresholded at P < 0.01). The white line marks the POS. (B) Relative response magnitudes, in terms of the average coefficient of beta values (EI/EC), in areas V3A and pV6 (n = 8 hemispheres). Bars represent the mean coefficients across participants ± standard error of the mean.

