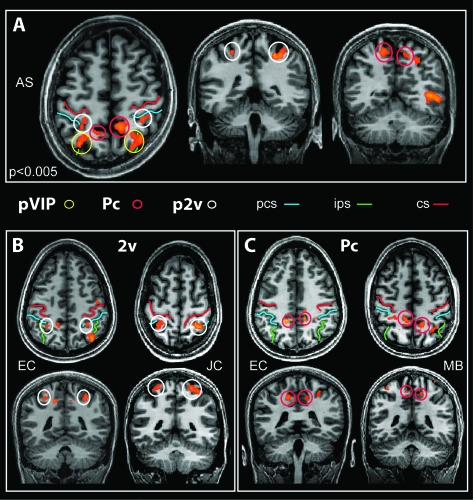
Figure 5.
Parietal regions activated by EC stimuli. (A) Slices from the brain of a representative participant, showing the location of all 3 parietal regions (p2v, pVIP, and Pc) in the same axial slice (left) and in coronal view. (B, C) Location of areas p2v (B) and Pc (C) in slices from 2 other participants. The 3 regions are identified with colored circles as in other figures. Three sulci are marked by colored lines: central sulcus (cs), intraparietal sulcus (ips), and postcentral sulcus (pcs). T values are color coded as in Figure 3.

