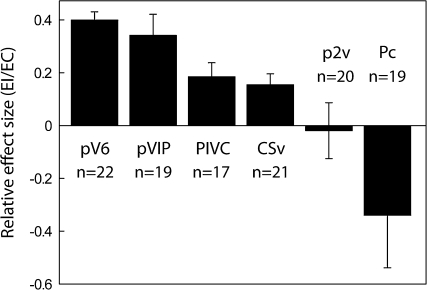
Figure 6.
Average coefficient of beta values (EI/EC) in areas pV6, pVIP, PIVC, CSv, p2v, and Pc. Beta values were extracted from functionally defined ROIs (see Materials and Methods and Results). Bars represent the mean coefficients ± SEM across runs and participants (n indicates number of hemispheres).

