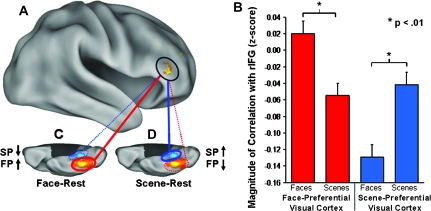
Figure 2.
LF-BOLD correlations during rest were modulated by previous task. (A) Region in the rIFG (circled) showing a task by ROI interaction for correlations with the FP- and SP-ROIs (t > 3.4, P < 0.001, 113 contiguous voxels; peak activation in MNI coordinates: x = 48, y = 36, z = 4; activation displayed at a threshold of: t > 2.76, P < 0.005). (B) Paired samples comparisons revealed a significant simple effect of task on correlations between rIFG and both the FP- and SP-ROIs (FP-ROI t = 3.0, P < 0.01, 2-tailed; SP-ROI t = −3.3, P < 0.01, 2-tailed). (C) Correlations with the FP-ROI increased during face–rest relative to scene–rest; (D) Correlations with the SP-ROI increased during scene-rest relative to face-rest. (C, D) The orange/yellow scale and blue-scale ROIs overlaid on the right ventral cortical surface images show the degree of overlap of all FP- and SP-ROIs, respectively, for all participants (n = 30); red and blue lines indicate correlation with FP-ROI and SP-ROI, respectively; solid lines and dotted lines indicate increased correlations and decreased correlations, respectively. Error bars represent standard error of the mean calculated for within-subjects design.

