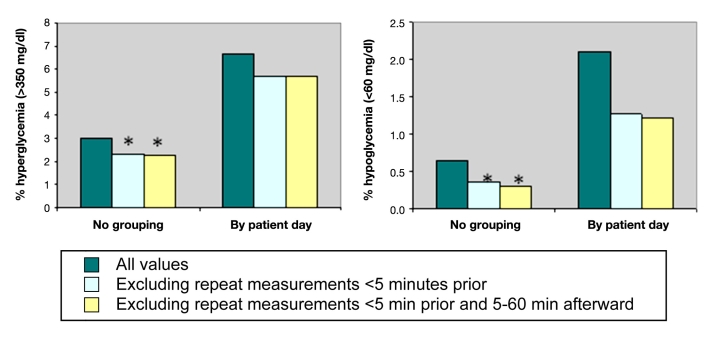
Figure 3.
Rates of hyperglycemia and hypoglycemia analyzed without grouping and grouped by patient-day. Exclusion of repeat values within 5 min had a greater effect than exclusion of repeat values 5–60 min later. The asterisks represent p < .001 versus all values. P values could not be calculated for comparisons involving measures based on at least one episode per day (by patient-day), since excluding repeat values could not increase these proportions.

