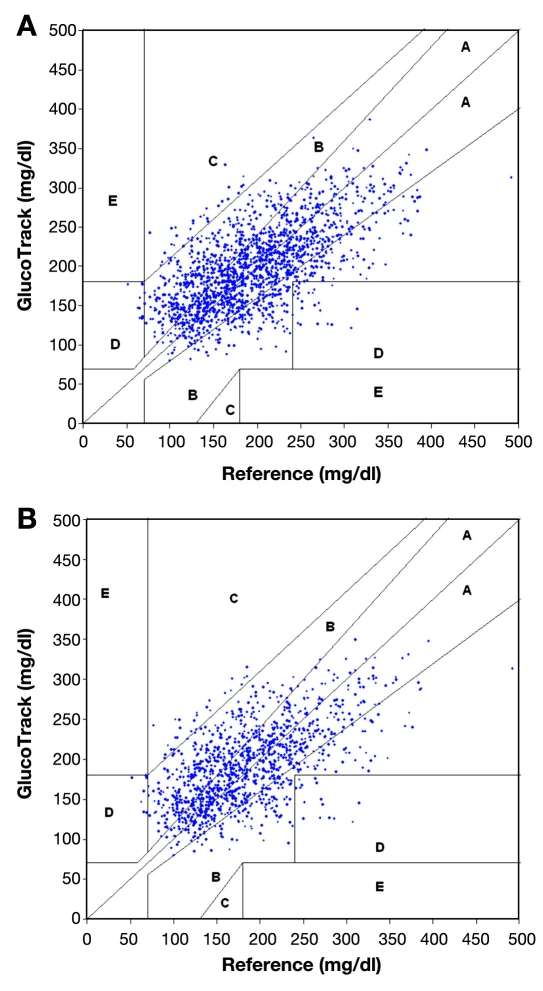
Figure 15.
(A) Clarke error grid of GlucoTrack glucose monitor readings of all data pairs (1,772 points) for days 1 and 2: 60% in zone A,36% in zone B, 2% in zone C, and 2% in zone D. (B) Clarke error grid of GlucoTrack glucose monitor readings on a different day than calibration (day 2) only (1,225 points): 57% in zone A, 39% in zone B, 2% in zone C, and 2% in zone D.

