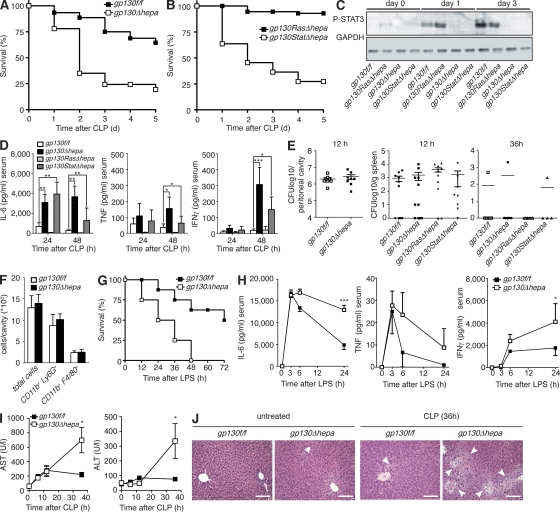
Figure 1.
gp130–STAT3 signaling in hepatocytes is protective during polymicrobial sepsis and tempers the inflammatory response. (A) Decreased survival of gp130Δhepa mice after CLP (n = 45 per group; pooled data of six independent experiments). (B) Decreased survival of gp130StatΔhepa mice compared with gp130RasΔhepa mice after CLP (n = 18 per group; pooled data of three independent experiments). (C) Western blot for phospho-STAT3 (P-STAT3) in lysates of liver samples taken at the indicated time points. (D) Serum cytokine levels in gp130Δhepa and gp130StatΔhepa mice compared with controls. IL-6, TNF, and IFN-γ were measured by ELISA in serum samples collected at the indicated time points after CLP (n = 10 per group; pooled data of three independent experiments). (E) Bacterial burdens in the peritoneal cavity (left) and in spleens (right) were determined 12 and 36 h after CLP by plating serial dilutions of peritoneal lavage fluid or spleen tissue homogenate on agar plates. CFUs were counted after overnight incubation (n = 8–10 per group; pooled data of three independent experiments). (F) Recruitment of immune cells to the peritoneal cavity in gp130Δhepa and control mice. Peritoneal cavities were lavaged 18 h after CLP, and infiltrating cells were counted and analyzed by flow cytometry. CD11b+Ly6G+, neutrophils; CD11b+F4/80+, monocytes and macrophages (n = 5 per group; one out of three independent experiments is shown). (G) Endotoxic shock was induced by injection of 20 mg/kg LPS and survival was determined (n = 10 per group; pooled data of three independent experiments). (H) Serum cytokine concentrations in gp130f/f and gp130Δhepa mice after LPS treatment were measured by ELISA (n = 8 per group; pooled data of three independent experiments). (I) Serum concentrations of aspartate transaminase (AST; left) and alanine transaminase (ALT; right; n = 5 per group; one out of three independent experiments is shown). (J) Representative hematoxylin and eosin staining of histological sections of liver tissue. Bars, 100 µm. *, P < 0.05; **, P < 0.01; ***, P < 0.001. Data are presented as means ± SEM.

