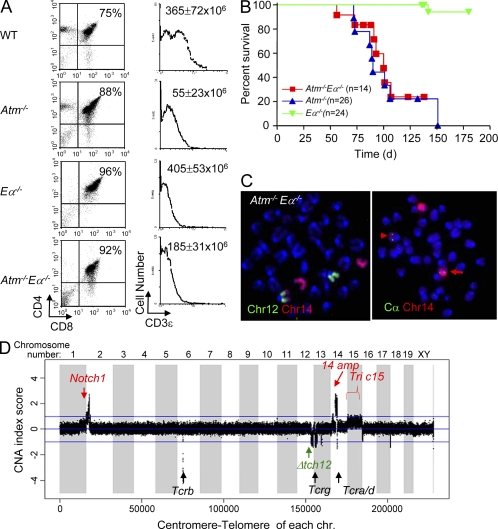
Figure 5.
Ea is not required for ATM-deficient thymic lymphoma with recurrent translocations and amplifications. (A) FACS analyses of CD4 and CD8 expression on WT, Atm−/−, Eα−/−, and Atm−/−Eα−/− thymocytes. The number at the top right quadrant of each dot plot indicates the percentage of CD4+CD8+ DP T cells in total live thymocytes. Surface CD3 levels of gated DP cells (gated on top right quadrant of the dot plot) are plotted on the histogram on the right. The total thymocyte number (average ± standard deviation) from at least three mice of each genotype (at 4–6 wk of age) is marked in the top right corner of the histogram plots. FACS analyses were performed for at least three mice of each genotype independently, and representative plots are shown. (B) Survival analysis of Atm−/−Eα−/− mice and littermate control Atm−/− and Eα−/− mice. (C) Representative chromosome paints and FISH analyses show t(12:14) translocations involving the Tcra/d locus in one Atm−/−Eα−/− thymic lymphoma (6099). The red arrow indicates the normal chromosome 14 and the arrowhead indicates the t(12;14) translocations. Similar results were obtained for all five Atm−/−Eα−/− thymic lymphomas analyzed. 20 metaphases were analyzed from each tumor, and >80% of the metaphases from each tumor had the clonal t(12;14) translocation. (D) Representative CGH analyses of Atm−/−Eα−/− thymic lymphoma DNA. CGH analyses were performed once for each tumor. The analysis shown is for DNA from tumor 5696 and is representative of the results from CGH analyses of five Atm−/−Eα−/− thymic lymphomas. The y axis is amplification/deletion index (LN tumor/kidney ratio of each tumor analyzed). The x axis depicts the 20 mouse chromosomes as indicated (1–19 plus chromosome x and y and centromere to telomere). Red arrows and text indicate recurrent amplifications of sequences corresponding to the Notch1 and Chr14amp probes, as well as trisomy of chr 15 (Tric15). The black arrows and text indicates the various TCR loci. The green arrow and text indicates recurrent deletions in the telomeric portion of chromosome 12 (Δtch12).

