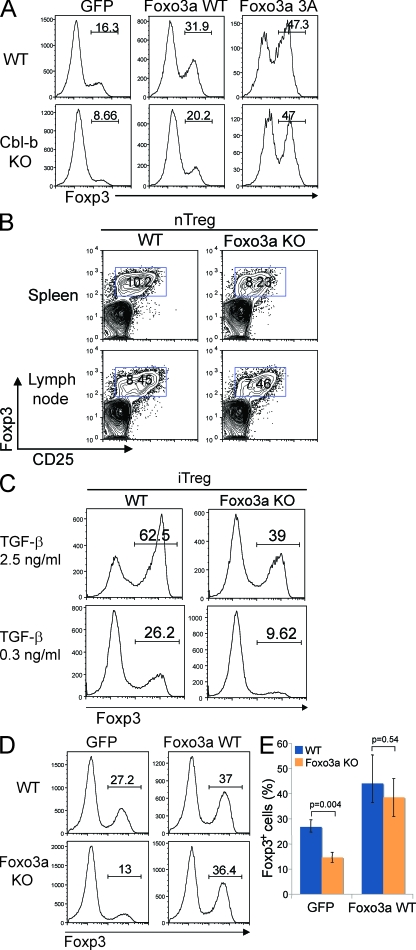
Figure 4.
Foxo3a regulates Foxp3+ iT reg cell differentiation. (A) Naive CD4+ T cells from WT and Cbl-b KO mice were stimulated with anti-CD3 and anti-CD28 for 2 d and retrovirally transduced with control-IRES-GFP (GFP), Foxo3a WT-IRES-GFP (Foxo3a WT), or Foxo3a 3A-IRES-GFP (Foxo3a 3A). After infection, TGF-β was added and Foxp3 expression was assessed 3 d later by FACS analysis. The percentages of Foxp3-expressing cells in gated GFP-positive cells are shown. Data are representative of four independent experiments. (B) nT reg cells in the spleen and lymph nodes of Foxo3a KO mice. The spleen and the lymph node cells from WT and Foxo3a KO mice were stained with anti-CD4, anti-CD25, and anti-Foxp3. The percentages of Foxp3-expressing cells in CD4 T cells are shown. Data are representative of three independent experiments. (C) Naive CD4+ T cells were stimulated with anti-CD3 and anti-CD28 in the presence of indicated concentrations of TGF-β for 3 d. Foxp3 expression was assessed by FACS analysis. The percentages of Foxp3-expressing cells in gated CD4 T cells are shown. Data are representative of five independent experiments. (D) Naive CD4 T cells from WT and Foxo3a KO mice were stimulated with anti-CD3 and anti-CD28 for 2 d and retrovirally transduced with control-IRES-GFP (GFP) or Foxo3a WT-IRES-GFP (Foxo3a WT). 1 d after infection, TGF-β was added, and Foxp3 expression was assessed 3 d later by FACS analysis. A representative of three repeated experiments. (E) The percentages of Foxp3-expressing cells in GFP-positive cells as shown in D are calculated and shown as mean ± SD of three independent experiments. Statistical significance of the data were evaluated by unpaired two-tailed Student’s t test.

