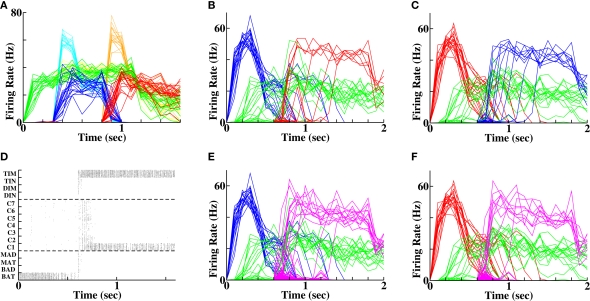
Figure 5.
Diminished forward and reverse recall following weaker prior stimuli. (A) Weak stimulation protocol. Bold green, blue and red traces represent population-averaged activity of cells representing context (“C1”), first word (“BAT”) and second word (“DIN”) respectively. Faint traces in yellow, cyan and orange reproduce the traces under a strong stimulus for comparison. Note the reduced peak height, but identical final firing rates following weak stimuli. (B) Forward recall at 35% success (compare Figure 4D with identical color scheme). (C) Reverse recall at 50% success (compare Figure 4F with identical color scheme). (D) Set of spike rasters for an example error, where a population, which had not received prior stimulation, becomes activated. (E) Average activity of populations without prior stimulation (magenta) demonstrate multiple examples of error during forward recall (blue and green traces depict activity of first word, “BAT”, and context, “C1”, as in (B)). (F) Average activity of populations without prior stimulation (magenta) demonstrate multiple examples of error during reverse recall (red and green traces depict activity of second word, “DIN”, and context, “C1”, as in (C)).

