Figure 2.
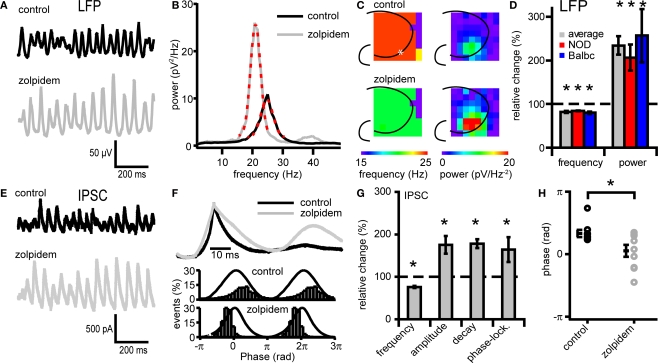
Zolpidem affects both Fast network oscillations and IPSCs on CA3 pyramidal cells. (A) Example traces of oscillations in before and after zolpidem (1 μM) application from a NOD mouse. (B) Power spectral density plot corresponding to the traces in (A). Red dotted lines show Gaussian fit. (C) Left, frequency of fast network oscillations at control and zolpidem at different electrodes. Right, power of fast network oscillations at control and different concentrations of zolpidem in wild-type mice at different electrodes. The asterix marks the recording site of the LFP (A) and IPSCs (D). (D) Changes in peak frequency and power by zolpidem. Data are normalized to control data. Zolpidem decreases the frequency and increases the power in both NOD and Balbc mice (n = 4 and n = 5 respectively, p < 0.05). (E) Example traces of IPSCs in CA3 pyramidal cells before and after zolpidem application from a NOD mouse. Traces correspond to the field potential traces in (A). (F) Average IPSC normalized to peak values from one cell from a NOD mouse. Zolpidem increases the duration of the IPSC. (G) Zolpdem effects on IPSC frequency, τ decay times, amplitude and phase-locking relative to the field oscillation (n = 4 and n = 5 respectively, p < 0.05). (H) Average phase of IPSCs in control and zolpidem. Zolpidem shifts the occurrence of IPSCs relative to the field (p < 0.05). All data are normalized to control data.

