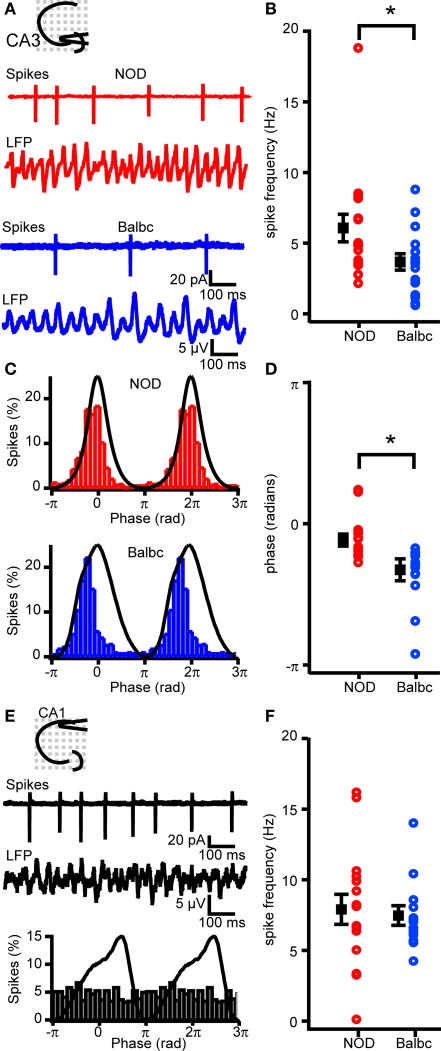
Figure 7.
Spike timing and frequency differs between NOD and Balbc mice. (A) Example traces of spikes recorded from CA3 pyramidal cells in cell-attached mode and field potential in NOD and Balbc mice. (B) Average firing frequency of CA3 pyramidal cells in NOD (n = 16) is higher than in Balbc (n = 16, p < 0.05) mice. (C) Average waveform of the field oscillation spike probability histogram at different phases of the oscilation from a cell from a NOD (top) and a Balbc (bottom) mouse. (D) I. Average phase of spikes. Spikes in CA3 pyramidal cells from Balbc mice occur at a earlier phase than in NOD mice (p < 0.05). (E) Example traces of spikes recorded from CA1 pyramidal cells from a Balbc mouse in cell-attached mode and field potential (top) and average spike probability histogram at different phases of the oscillation (bottom). (F) Average firing frequency of CA1 pyramidal cells in NOD and Balbc mice. Average values + SEM are shown in black.

