Fig. 7.
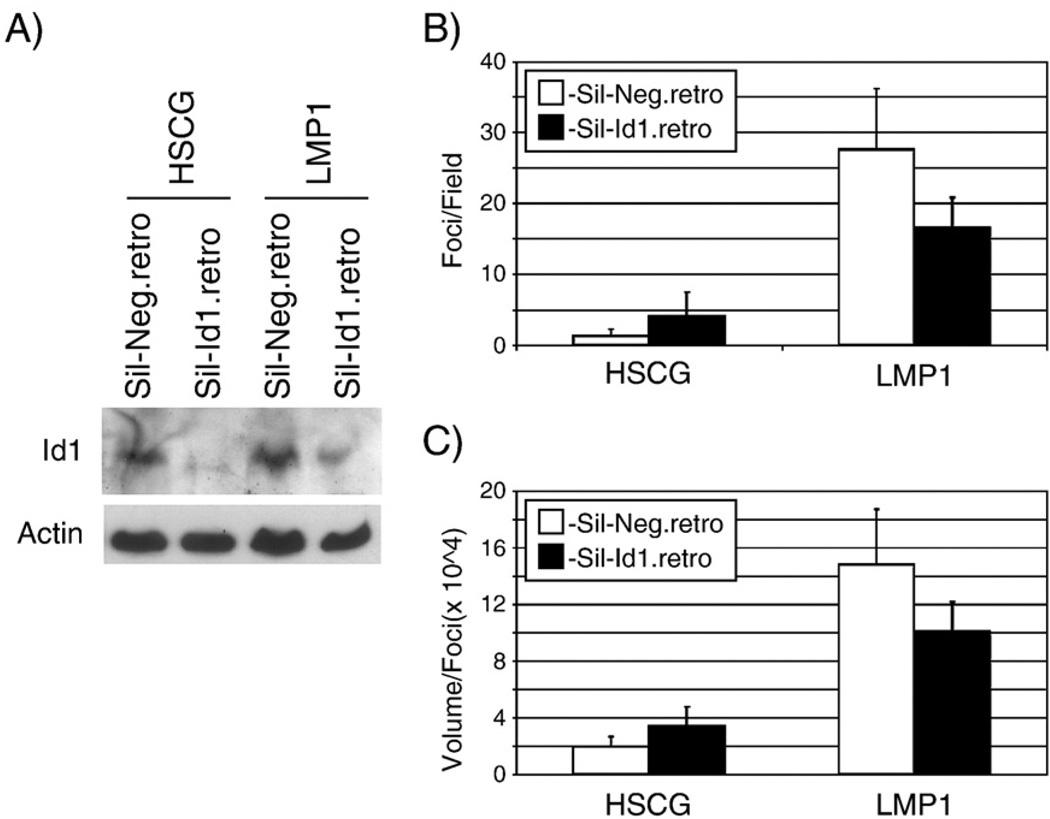
Effects of decreased Id1 on focus formation. Rat-1 stable cell lines were analyzed by western blotting for Id1 expression (panel A). Total cell lysates from cell lines stably expressing control siRNA (Sil-Neg.retro) or Id1 siRNA (Sil-Id1.retro) and transduced with control (HSCG) or LMP1-expressing retrovirus were analyzed for Id1 levels compared to Actin loading control. Fifty micrograms of protein were loaded per lane. Doubly transduced cells were also seeded in 12-well plates for focus formation assays for 10 days. Monolayers were fixed and stained with crystal violet and five separate fields were photographed per condition using a dissecting microscope. The foci were quantitated using ImageQuant software and the mean number and size of foci were plotted (panels B and C, respectively). Error bars represent the standard deviation in the five separate fields.

