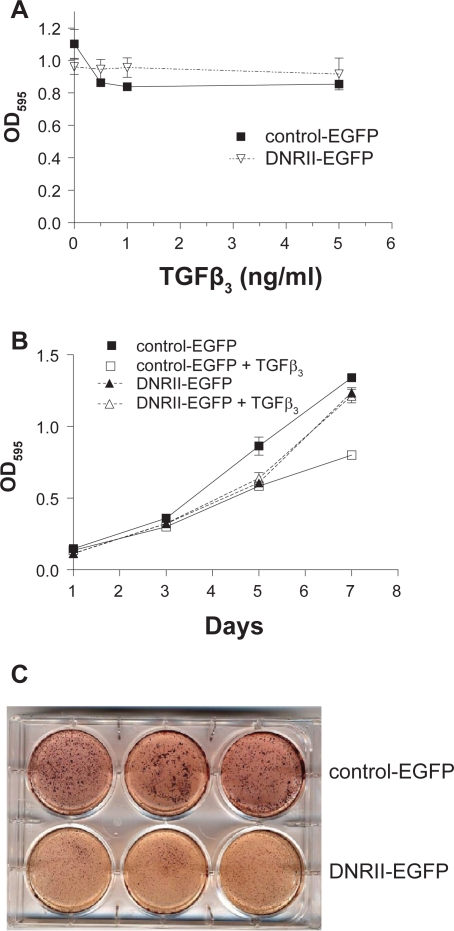
Figure 2.
Effect of DNRII expression on the growth of HEC-1-A cells. A) Control-EGFP and DNRII-EGFP cells were plated in a 96-well plate at 1,000 cell/well and treated with different concentrations of TGFβ3 for five days. Cell number in each well was indirectly measured with MTT assay. Each data point represents the mean ± SEM from four wells. B) Cells were plated at 1,000 cell/well in 96-well plates and treated with or without TGFβ3 at 1.0 ng/ml. MTT assay was performed every other day till day 7. Each data point represents the mean ± SEM from four wells. C) Exponentially growing control-EGFP and DNRII-EGFP cells (3,000 cells) were resuspended in 1 ml of 0.4% low melting point agarose dissolved in the culture medium and placed on top of a 1 ml under layer of 0.8% agarose in each well of a six-well plate. After four weeks of incubation, cell colonies were visualized by staining with 1 ml of p-iodonitrotetrozolium violet.

