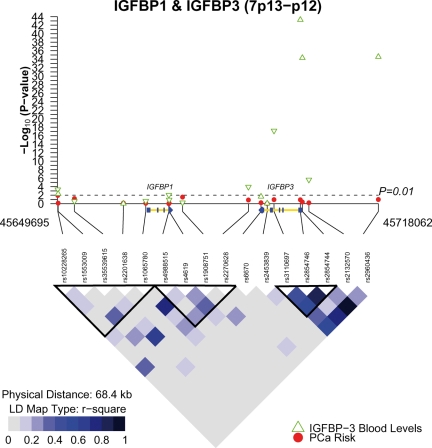
Figure 2.
IGFBP1 and IGFBP3 LD and SNP associations with IGFBP-3 blood levels and prostate cancer risk among Caucasians in the BPC3. The upper panel is a plot of the −log10 P-values for IGFBP1 and IGFBP3 SNP associations with IGFBP-3 blood levels (green triangles; N = 5667) and prostate cancer risk (red circles; 6012 PCa cases/6641 controls). The direction of the green triangles indicates the direction of effect between the minor allele and IGFBP-3 blood levels. The IGFBP1 and IGFBP3 loci are illustrated in the x-axis with the exons colored blue and the introns yellow. The arrow indicates the 5′ → 3′ direction. The P-values are plotted according to genetic position. The bottom panel contains an LD plot for the 16 IGFBP1 and IGFBP3 SNPs among PLCO Caucasian controls. The r2 values are used for LD. The black triangles indicate the haplotype blocks. Corrected P-values for blood level associations: rs2270628 = 8.6 × 10⁻³; rs3110697 = 1.1 × 10⁻¹⁶; rs2854746 = 8.8 × 10−43; rs2854744 = 8.1 × 10⁻³⁴; rs2132570 = 1.8 × 10⁻⁴; rs2960436 = 4.4 × 10⁻³⁴.

