Figure 5.
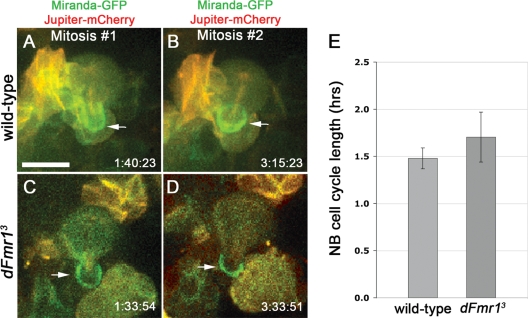
Live imaging of dividing neuroblasts indicates no change in the duration of the cell cycle in third instar dFmr1 mutant brains compared to wild-type. (A–D) Miranda-GFP (shown in green) and Jupiter-mCherry (shown in red) label neuroblasts, GMC daughters and mitotic spindles, respectively. Several mitoses were imaged live in cultured explanted brains. Two mitoses are shown at the time of GMC pinching off (arrows). Genotypes and division times as indicated. Note: dFmr1 neuroblasts shown were located deep within the brain, hence the lower quality image. (E) Quantification of cell cycle time shows no significant difference between wild-type (1.48 ± 0.11 h) and mutant brains (1.70 ± 0.26 h). Imaging was performed using early third instar brains. Student's t-test was used to calculate statistical significance (see text for P-value). Scale bar in (A) 10 µm.

