Figure 6.
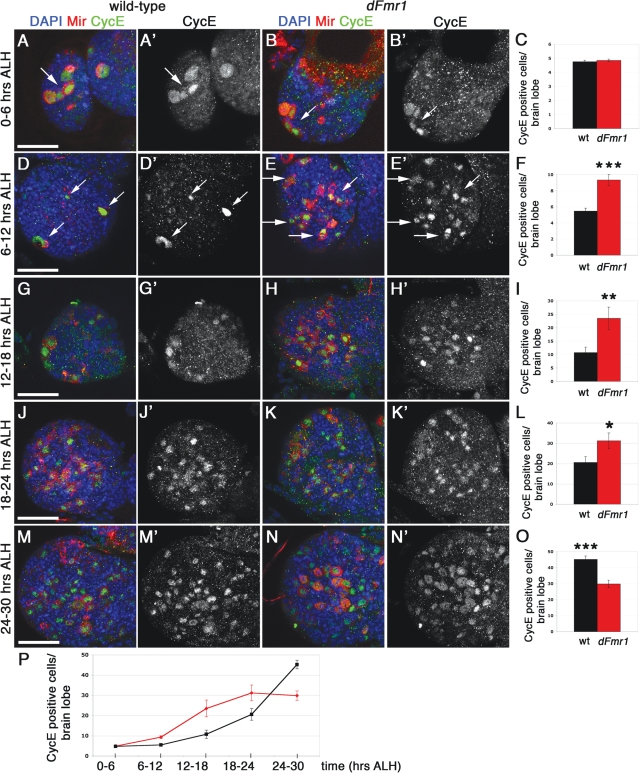
Loss of dFmr1 leads to premature exit from quiescence in the developing larval brain. Wild-type (w1118) and dFmr13/50M larval brains analyzed at different time points ALH, as shown. Brains were immunostained for Miranda and CycE (A–N′). DAPI was used to label nuclear DNA. (A–B′) At 0–6 h ALH, both wild-type (A, B, see arrows) and dFmr13/50M mutant brains (A′, B′, see arrows) display large, Miranda/CycE positive mb neuroblasts (NBs) only. (C) Quantification of Miranda/CycE double positive cells shows no significant change between genotypes at this timepoint. (D–E′) At 6–12 h ALH, wild-type brains contain four large mb NBs (D, D′, arrows). Note: only three out of the four mb NBs clearly visible in the single confocal slice shown. Mutant brains show an increased number of smaller, Miranda/CycE positive NBs (E, E′, arrows) compared with controls. (F) The total number of Miranda/CycE positive NBs at this time point is significantly increased in the dFmr13/50M mutant brains. (G–H′) At 12–18 h ALH, the number of Miranda/CycE positive cells continues to be significantly increased in dFmr13/50M mutant brains (H, H′), quantified in (I). (J–K′) At 18–24 h ALH, the number of Miranda/CycE positive cells remains significantly increased in dFmr13/50M mutant brains (K, K′), quantified in (L). (M–N′) At 24–30 h ALH, the number of Miranda/CycE positive cells is now significantly increased in w1118 brains (M, M′), compared with the mutant brains (N, N′), quantified in (O). (P) Line plot of average CycE/Miranda positive neuroblasts at each 6 h interval ALH. Student's t-test was used to calculate statistical significance (see text for P-values). Scale bars: (A) 30 µm, (D) 30 µm, (G) 30 µm, (J) 40 µm, (M) 40 µm. Panels (A–B′) represent projections of two to three individual confocal slices to capture all mb neuroblasts. All remaining images represent single confocal slices (2 µm thick).

