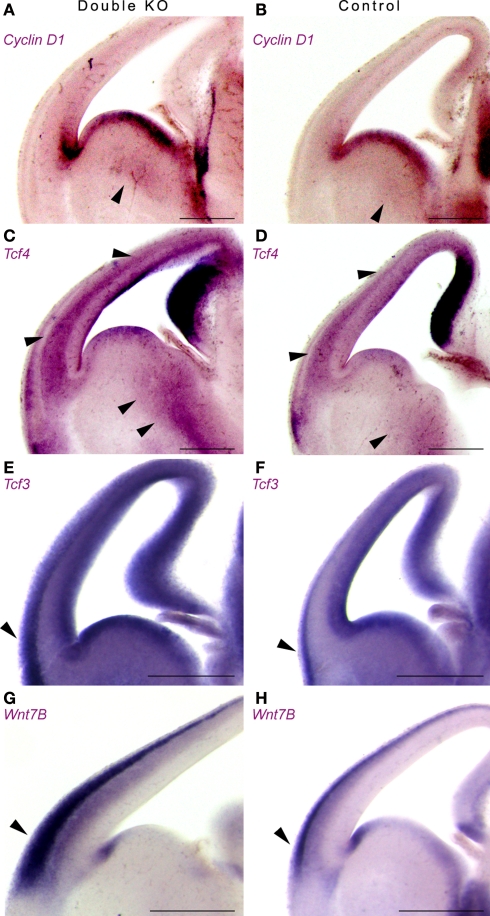
Figure 6.
Double KO brains exhibit increased and expanded expression of downstream and upstream components of the Wnt pathway using in situ hybridization. (A,B) Expression of Cyclin D1 in double KO (A) or control (B). Note the expansion in the area expressing Cyclin D1 in the GE. (C,D) Expression of Tcf4 in double KO (C) or control (D). Arrowheads mark the comparable GE area, as well as cerebral cortex area (E,F) Expression of Tcf3 in double KO (E) or control (F). Note the mutually exclusive pattern of expression between the Tcf3 and Tcf4. (G,H) Expression of Wnt7B in double KO (G) or control (H). The area that expressed high levels of nuclear β-catenin is marked with arrowheads. Scale bars are 0.5 mm.

