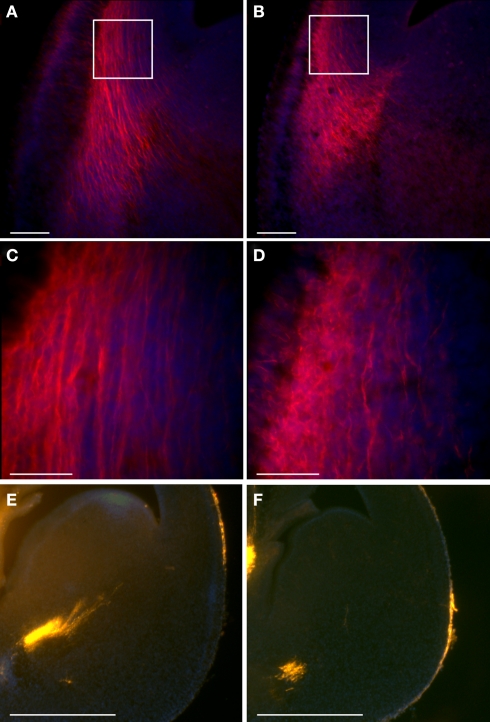
Figure 7.
Double KO mice exhibit earlier thalamocortical projections. (A–D) TAG-1 immunostaining of double KO (A,C) and control (B,D) mice. Scale bars: (A,B) – 100; (C,D) – 40 μm. The white boxes in (A) and (B) define the area shown in (C) and (D). (E,F) DiI stained thalamocortical fibers exhibit earlier projections in double KO brains (E) in comparison to the control brains (F). Scale bars are 500 μm.

