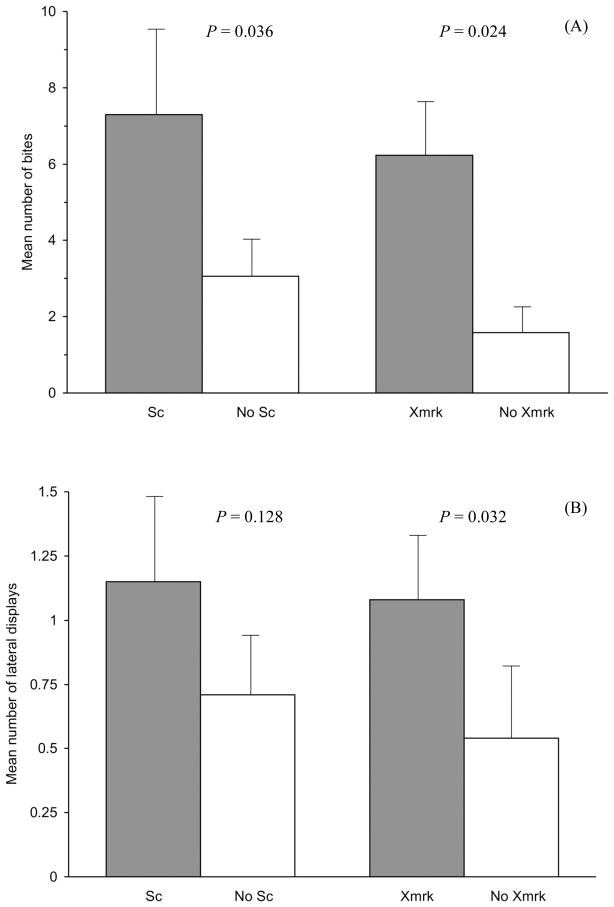
Figure 2.
The number of bites (A) and lateral displays (B) performed by X. cortezi males during the five minute MIS trials. The results of analysis 1 (aggression and Sc phenotype) are presented on the left side of each bar graph (Sc/no Sc) and the results of analysis 2 (aggression and the Xmrk genotype) are presented on the right side of each graphic (Xmrk/no Xmrk). As a reminder in both analyses 1 and 2, males were responding to the same stimulus, their mirror image with the Sc phenotype (i.e., no Sc males had the Sc phenotype painted on). Bars represent the mean ± SE.

