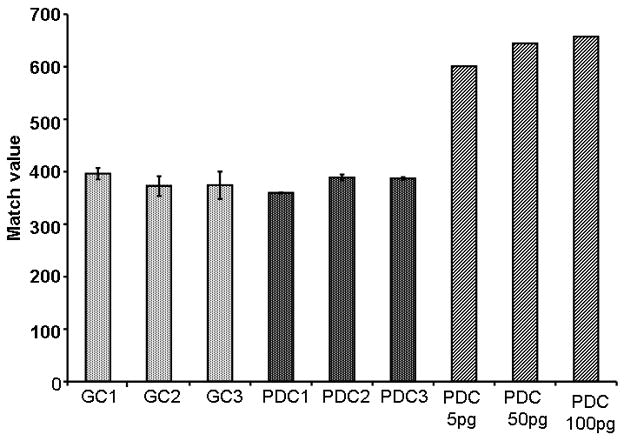
Figure 11.

Match values from a representative group of samples. Both Guamanian Control and Parkinson Dementia Complex (PDC) tissues were used in this study. Analysis of both groups reveal that BMAA is not at any detectable levels using this method. Low levels of BMAA (5 pg, 50 pg, and 100 pg) are spiked into PDC tissue, the match value PARAFAC output from the analysis increases. (GC = Guamanian Control Sample, PDC = Parkinson Dementia Complex Sample)
