
Figure 5.
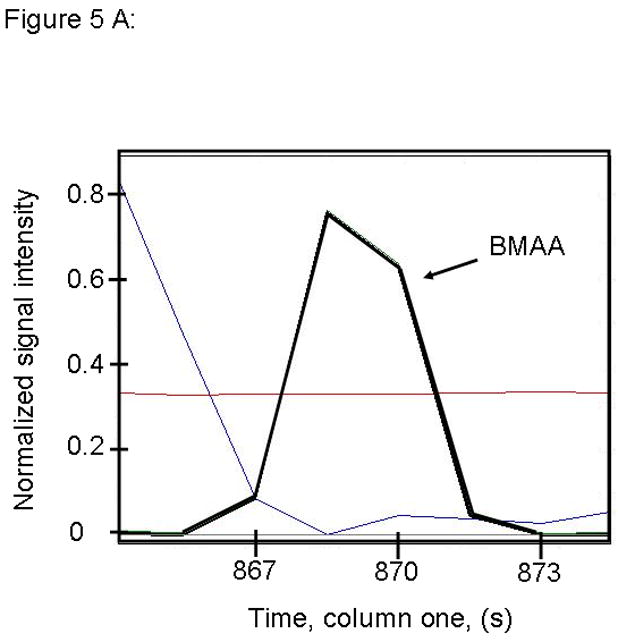
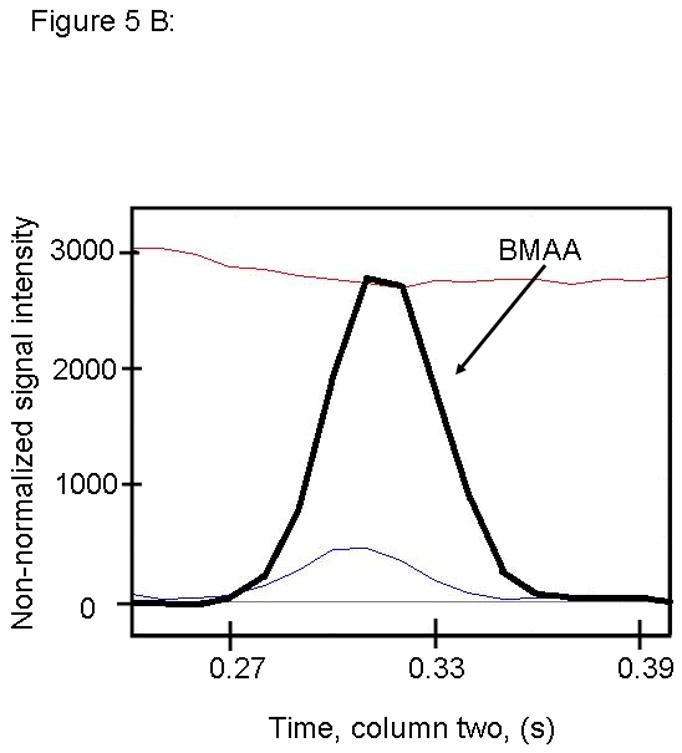
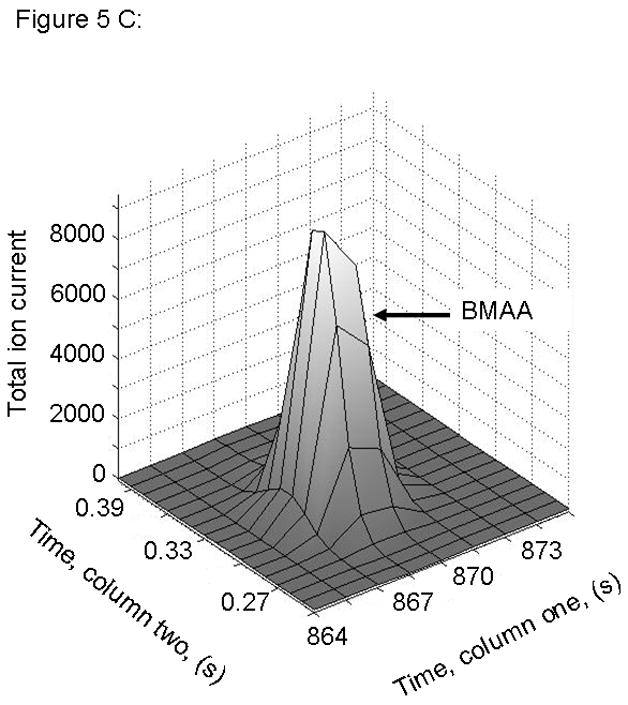
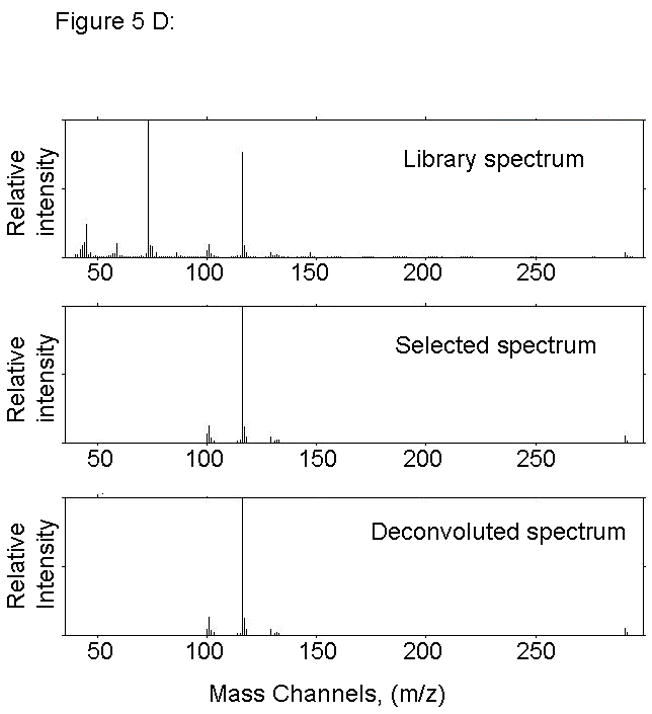
PARAFAC signal intensity for cerebrum standard containing BMAA that was added to the matrix in (A) Column one retention time window, and (B) Column two retention time window. (C) PARAFAC reconstructed total ion current (TIC) signal showing identified BMAA peak. (D) Mass spectral data from PARAFAC showing library template matching the deconvoluted BMAA peak. Non-bold lines in panels (A) and (B) indicate loadings (i.e., deconvoluted responses) that are due to noise, baseline, or other analytes. See ref [32].