Figure 9.

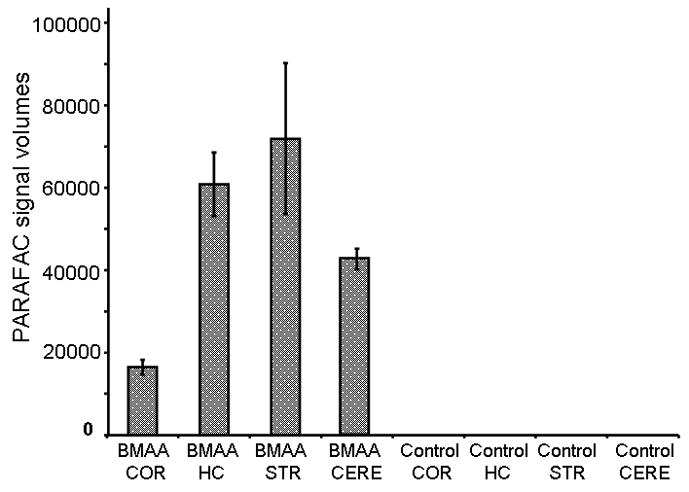
PARAFAC peak signal volumes for mouse brain samples for BMAA fed and Control diet fed mice. No BMAA was detected in any of the samples from mice fed a control diet. COR = Cortex, HC = Hippocampus, STR = Striatum, CERE = Cerebellum

PARAFAC peak signal volumes for mouse brain samples for BMAA fed and Control diet fed mice. No BMAA was detected in any of the samples from mice fed a control diet. COR = Cortex, HC = Hippocampus, STR = Striatum, CERE = Cerebellum