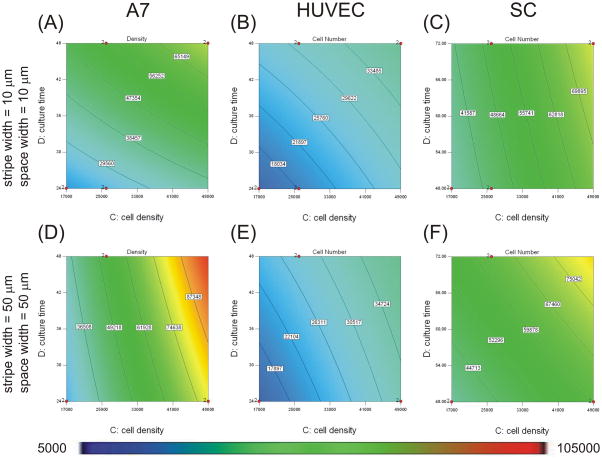
Figure 5. Plating density and culture time affected terminal density of cells.
Contour graphs showing the effects of protein stripe and space width on cell number when plated on micropatterns with 10 μm protein stripe and space width (A–C) or micropatterns with 50 μm protein stripe and space width (D–F). Experimental conditions were determined and analyzed with Design Expert 7 software. An ANOVA model of final cell number was calculated and graphed for A7s (A,D), HUVECs (B, E), and SCs (C, F). Cell number magnitudes are indicated by contour lines and colorimetric scale, blue-red, 5K–105K cells cm−2. Design points carried out experimentally are indicated with red dots.

