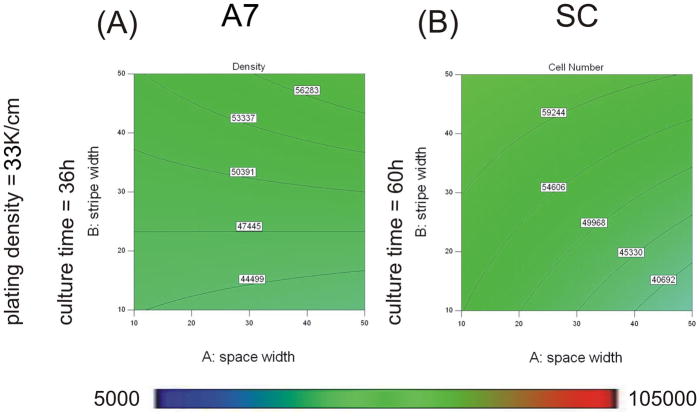
Figure 6. Protein stripe width affected the confluence of A7s and SCs.
Contour graphs showing the effect of protein stripe and space width on cell number when plated at 33K/cm2 for 36h for A7s (A) and 60h for SCs (B). Experimental conditions were determined and analyzed with Design Expert 7 software. An ANOVA model of cell number was calculated and graphed for A7s (A) and SCs (B). Cell number magnitudes are indicated by contour lines and colormetric scale, blue-red, 5K–105K cells cm−2. Design points carried out experimentally are indicated with red dots.

