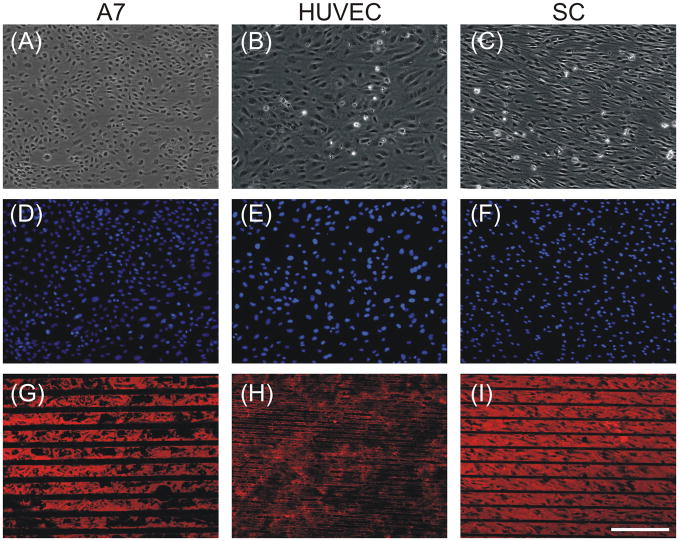
Figure 7. Experimental runs supported model predictions.
Phase contrast (A–C) and epifluorescent images (D–I) of A7s plated at 49K cells cm−2 for 48h on LN stripes of 50 μm with 20 μm spaces (A, D, G), HUVECs plated at 49K cells cm−2 for 48h on FN stripes of 10μm with 10 μm spaces (B, E, H), and SCs plated at 49K cells cm−2 for 48h on LN stripes of 50 μm with 10 μm spaces(C, F, I). Cultures were stained with DAPI (D–F), with anti-LN (G,I) or anti-FN (H). Scale bar, 200 μm.

