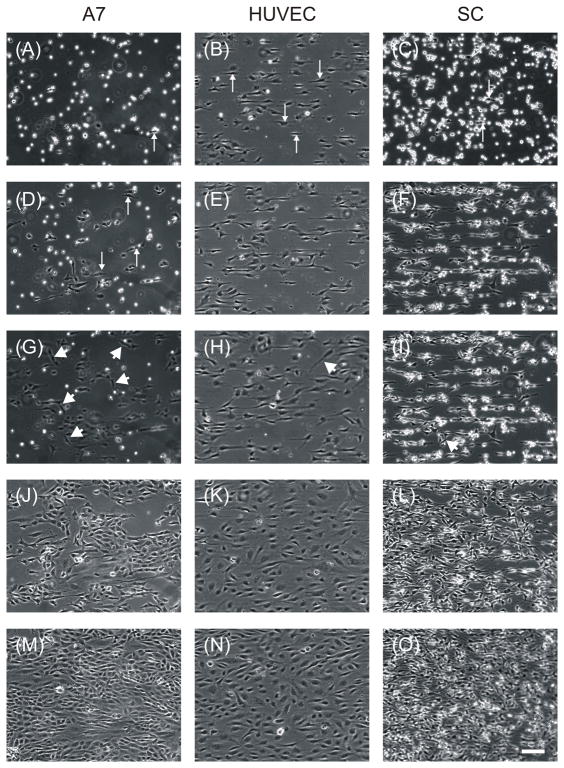
Figure 8. Timelapse microscopy of aligned monolayer generation revealed differences among cells types.
Phase contrast images obtained by timelapse microscopy of A7s plated at 49K cells cm−2 after 1h (A), 4h (D), 10h (G), 24h (J), and 48h (M) on LN stripes of 50 μm with 20 μm spaces, HUVECs plated at 49K cells/cm2 after 1h (B), 4h (E), 10h (H), 24h (K), and 48h (N) on FN stripes of 10μm with 10 μm spaces, and SCs plated at 49K cells/cm2 after 1h (C), 4h (F), 10h (I), 24h (L), and 48h (O) on LN stripes of 50 μm with 10 μm spaces. Arrows indicate cells beginning elongation along micropattern. Arrow heads indicate cells moving in directions different from the pattern. Scale bar, 100 μm.

