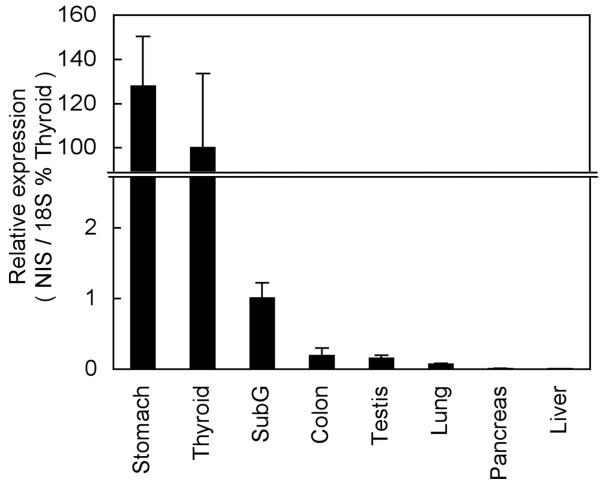
Figure 1.
Comparative tissue distributions of NIS mRNA. NIS mRNA levels were estimated by quantitative real-time RTPCR (qPCR) experiments and standardized in respect to 18S mRNA expression. Data are presented as a percentage of the value obtained for thyroid gland. 'SubG' in the panel stands for the submandibular gland.

