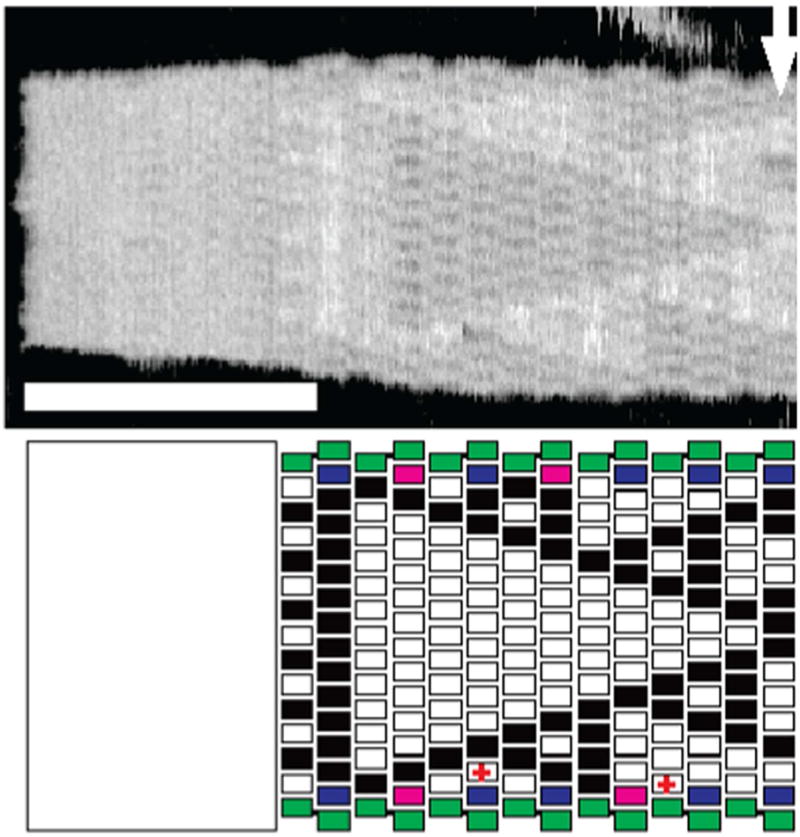
Figure 4. Seeded and Chaperoned Growth of Sierpinski Triangles.

The upper panel shows an AFM image of a Sierpinski triangle that is seeded by a DNA origami on the left. The lower panel is an interpretation. The tiles that flank the rectangle on the top and the bottom provide extra control on the growth of the image. The scale bar is 100 nm, and the arrow indicates where analysis stopped following change in width of the sample.
