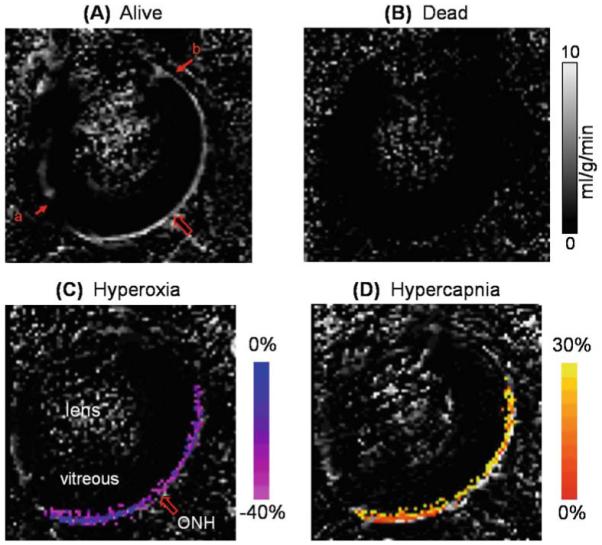
Figure 10.

A–D. Blood-flow MRI of the retina. Quantitative basal blood-flow images were obtained at 90 × 90 × 1000 μm from a representative rat alive (A) and dead (B). Blood-flow values in the retina and the ciliary body are high, whereas blood flow in the lens and vitreous are within noise levels. The large arrow indicates the location of the optic nerve head (ONH). Blood-flow data were obtained from one distal edge (a) to the other (b). Blood-flow percent-change maps responding to physiologic stimuli, (C) 100% O2 or (D) 5% CO2, obtained from a representative animal. Percent changes are overlaid on blood-flow maps. Color bars indicate blood-flow percent changes. Blood-flow changes due to hyperoxia and hypercapnia were statistically significantly different from baseline (air) (P < 0.05). Adapted from Figs. 2 and 4 of Li et al., Neuroimage.49
