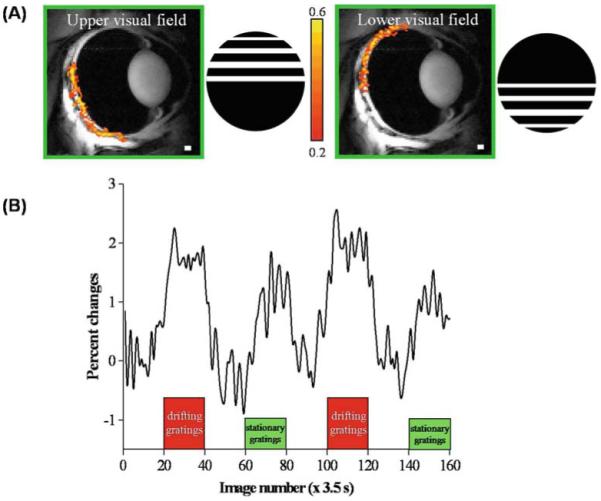
Figure 11.

A, B. fMRI of visual stimulation of the cat retina. A fMRI maps (468 × 468 × 1000 μm) of the upper and lower visual field using drifting gratings versus dark. The gratings were a square wave with 0.15 cycles/deg and 2 cycles/s. The color bar indicates the cross-correlation coefficient. B fMRI signal modulation under dark, drifting gratings and stationary gratings (same luminance). Positive signal changes are observed under both drifting-grating and stationary-grating stimuli relative to the dark basal conditions. Signal changes due to the drifting gratings are approximately twice that of stationary gratings. Adapted from Figs. 3 and 4 of Duong et al., Invest Ophthalmol Vis Sci.47
