Figure 3.

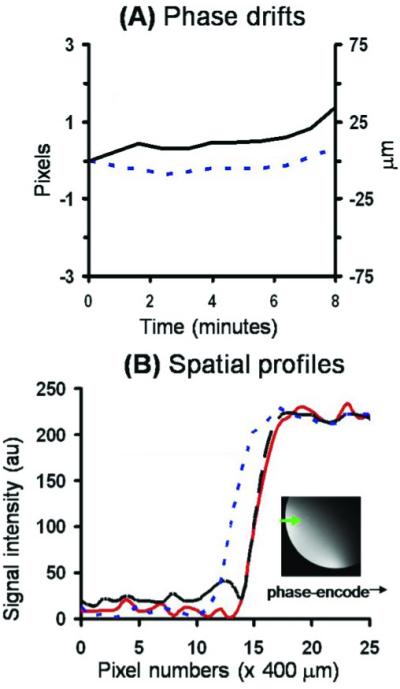
A, B. Magnetic resonance imaging (MRI) of a phantom by conventional gradient-echo MRI at 25 × 25 μm. A Temporal-phase evolution in the readout (------) and phase-encode (—) direction of the entire image. B Image intensity profile of the first (– – –) and last (------) original images, and the last image after phase correction (—). The profiles were obtained across the phantom in the phase-encoding direction as shown in the inset. Adapted from figures in Duong et al., J Magn Reson Imaging53 and Zhang et al., Proc Magn Reson Med.83
