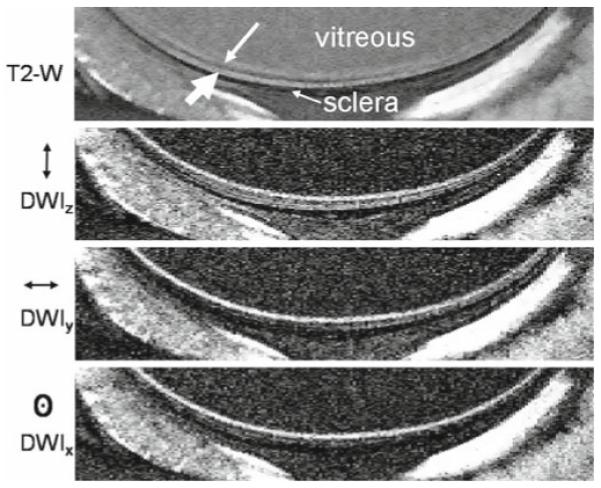
Figure 6.

Diffusion-weighted MRI of the cat retina. T2-weighted (TE = 40 ms) and diffusion-weighted (b = 504 s/mm2) images at 50 × 100 × 1500 μm. Diffusion-sensitizing gradients were placed along the x, y, or z axis separately. The small and large white arrows indicate the inner and outer bands, respectively. Reproduced from Fig. 5 of Shen et al., J Magn Reson Imaging.48
